
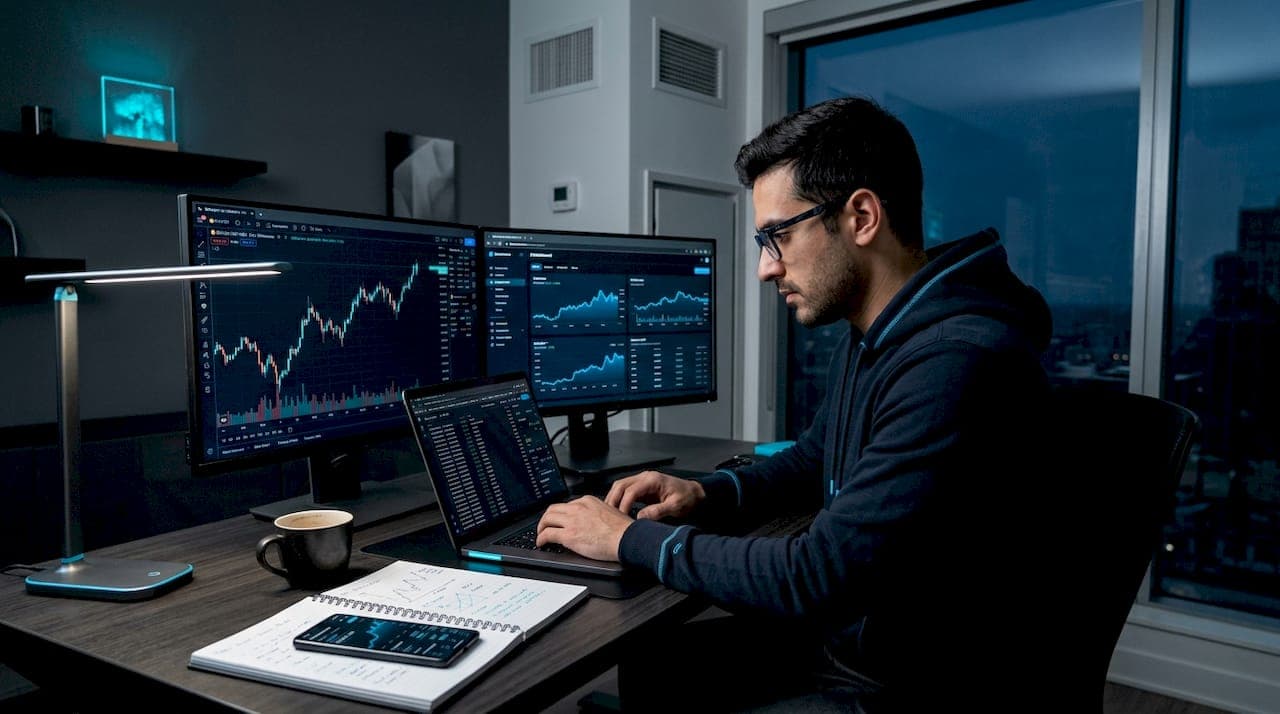
Performance analysis in crypto trading is the systematic process of reviewing trade outcomes, execution factors, and behavioral patterns to determine whether profitability comes from genuine skill or favorable market conditions. Most traders track price charts obsessively but ignore the feedback loop that actually separates consistent performers from lucky ones. The monthly self-audits recommended by 2026 trading guidance cover net PnL after fees and funding, slippage, and execution quality. Without that review process, traders optimize for the wrong variables and repeat the same costly mistakes. Understanding why crypto traders analyze performance is the first step toward building a trading practice that compounds over time.
Why crypto traders analyze performance: the core feedback loop
The purpose of measuring performance is not to keep score. It is to create a structured feedback loop that improves execution, risk management, and psychological discipline by separating genuine skill from favorable market conditions. A trader who made 40% returns during a Bitcoin bull run cannot assume the strategy works. The same strategy in a sideways or bear market may produce a 25% drawdown, revealing that the returns were regime-dependent, not skill-driven.
Crypto performance analysis starts with net profit and loss after all fees and funding costs. This single number tells you whether the strategy is viable. Everything else, including win rate, average win size, and execution quality, explains why that number looks the way it does. Traders who skip this layer of analysis are flying blind, reacting to equity curve movements without understanding their cause.
The feedback loop works in three stages. First, you record every trade with full context. Second, you measure outcomes against defined benchmarks. Third, you adjust strategy parameters based on what the data reveals, not what your gut suggests. This cycle, repeated monthly, is what separates traders who improve from traders who simply survive.

What core metrics and KPIs do crypto traders use for performance analysis?
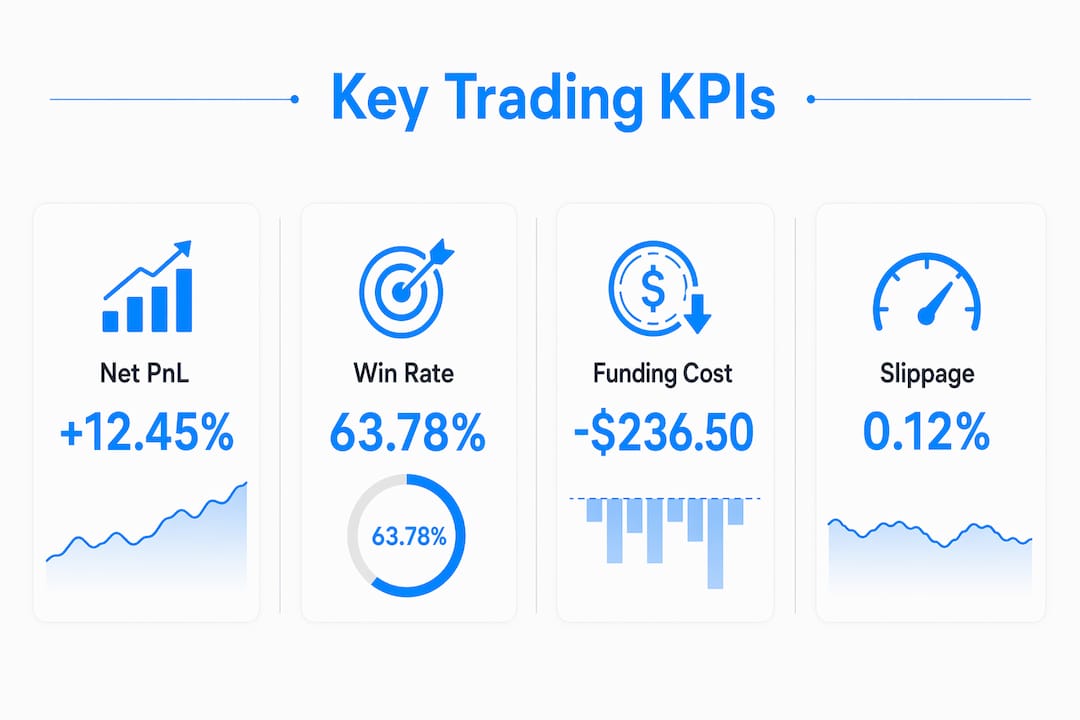
Net PnL after fees and funding is the baseline metric. Every other KPI is an explanation of it. Win rate tells you how often you are right. Average win divided by average loss tells you whether being right is worth anything. Profit factor, calculated as gross profit divided by gross loss, tells you whether the strategy has a positive expectancy over time. R-multiple measures each trade's outcome relative to the initial risk taken, giving you a normalized view of performance that removes position size distortion.
Crypto markets add a layer of KPIs that traditional markets do not require. Funding costs on perpetual futures contracts, liquidation proximity, and maker versus taker fill rates all affect net returns in ways that standard equity trading metrics miss entirely.
| KPI | What it measures | Healthy benchmark |
|---|---|---|
| Net PnL after fees and funding | True profitability | Positive after all costs |
| Win rate | Frequency of profitable trades | Context-dependent; 40% with 2:1 R works |
| Profit factor | Gross profit divided by gross loss | Above 1.5 indicates edge |
| Expectancy | Average expected return per trade | Positive number required |
| Funding cost ratio | Funding as a percentage of gross PnL | Below 5% is manageable |
| Maker/taker fill rate | Execution cost efficiency | Higher maker rate reduces costs |
Pro Tip: Isolate funding payments from trading fees in your journal. Perpetual futures funding can represent 10 to 20% of gross PnL over months, and misclassifying it as a trading fee distorts your ability to optimize the strategy correctly.
Slippage tracking is equally critical. Execution microdifferences during high-volatility periods can flip what looks like a profitable month into an actually negative one. Separating maker versus taker fills and entry/exit slippage prevents you from blaming the strategy when the real problem is execution.
How does performance analysis help traders control behavioral biases?
Behavioral biases are the most underestimated source of performance drag in crypto trading. FOMO causes traders to enter late into moves, accepting worse risk-reward ratios. Loss aversion causes traders to hold losing positions longer than the strategy dictates. Overconfidence after a winning streak leads to oversized positions that blow up when the streak ends. These are not personality flaws. They are predictable cognitive patterns that every trader faces.
Research links behavioral biases directly to measurable return degradation. FOMO-driven trading underperforms rules-based trading by 1.5 to 2.5% annually. That gap compounds significantly over a multi-year trading career. The mechanism is straightforward: emotional decisions override the strategy's statistical edge, introducing random variance that erodes the expectancy the strategy was built on.
Performance journaling counters this by forcing traders to confront actual outcomes rather than remembered ones. Human memory is selective. Traders tend to remember winning trades vividly and minimize losing ones in their mental accounting. A written record with timestamps, entry rationale, and outcome data removes that distortion entirely.
Best behavioral practices enabled by regular performance review:
- Tag every trade with the emotional state at entry (calm, anxious, FOMO-driven, revenge-motivated)
- Flag trades that deviated from the defined setup criteria and measure their performance separately
- Track the ratio of rule-compliant trades to impulsive trades each week
- Review losing streaks specifically for behavioral drift, not just market conditions
- Compare performance during high-volatility periods versus low-volatility periods to identify stress-driven errors
Pro Tip: Schedule a fixed weekly review of 20 to 30 minutes and a deeper monthly performance audit of 60 to 90 minutes. Small process and risk-sizing drift compounds over weeks before it appears on the equity curve, and catching it early is far cheaper than recovering from it.
Why separating market regime effects from execution matters
A strategy that performs well in a trending bull market may fail completely in a consolidating or bear market. This is not a strategy failure in the traditional sense. It is a regime mismatch. Traders who do not tag their trades by market regime cannot distinguish between these two outcomes, which leads to abandoning profitable strategies during temporary unfavorable conditions or, worse, continuing to run broken strategies during favorable ones.
Market regimes in crypto fall into four broad categories: bull trending, bear trending, range-bound consolidation, and high-volatility shock. Each regime rewards different strategy types. Momentum strategies, for example, generate strong returns in trending markets but produce significant drawdowns in range-bound conditions. Factor model analysis from Artemis shows that Momentum factors outperform BTC by large margins in trending regimes but carry materially different drawdown profiles when conditions shift.
| Market regime | Momentum strategy | Mean-reversion strategy | Volatility strategy |
|---|---|---|---|
| Bull trending | Strong outperformance | Underperforms | Moderate gains |
| Bear trending | Moderate gains (short bias) | Underperforms | Strong gains |
| Range-bound | Significant drawdown | Outperforms | Low returns |
| High-volatility shock | Mixed results | High risk | Strong gains |
Tagging every trade with the prevailing regime at entry gives you a dataset that reveals which strategies actually have edge in which conditions. This is how professional traders build regime-aware playbooks rather than applying a single approach to all market environments. Without this attribution layer, performance analysis produces conclusions that are statistically meaningless.
What unique challenges do crypto markets present for performance analysis?
Crypto markets create performance analysis problems that traditional equity or forex traders never encounter. Perpetual futures contracts charge funding payments every one, four, or eight hours depending on the exchange. These payments can be income or expense depending on whether you are long or short relative to the funding rate direction. Treating funding costs like holding costs rather than trading fees is the correct approach, because their timing and magnitude depend on contract mechanics, not trade execution decisions.
Liquidity fragmentation across exchanges like Binance, Bybit, OKX, and dYdX means that the same trade executed on different venues produces different fill rates, fee structures, and slippage profiles. A strategy backtested on one exchange may underperform on another purely due to execution differences. Combining results across venues without tagging by exchange and contract type obscures which positions are generating returns and which are creating drag.
Additional fields required in a crypto-specific trading journal:
- Funding paid or received per position, logged separately from trading fees
- Contract type (spot, perpetual, quarterly futures, options)
- Exchange and venue for each fill
- Fill source (maker or taker) for each entry and exit leg
- Partial fill details when orders are not fully executed at a single price
- Liquidation distance at entry and peak adverse excursion during the trade
Pro Tip: Use journaling tools built specifically for crypto markets rather than adapting stock trading spreadsheets. Generic tools do not capture funding mechanics or multi-leg perpetual positions accurately, which means your performance attribution will be wrong from the start.
How to avoid overtrading and activity without progress
Overtrading is the most common way skilled traders destroy their own edge. The logic is counterintuitive: taking more trades feels productive, but each additional trade beyond the high-quality setups adds noise to the dataset and dilutes the statistical edge the strategy was built on. Excessive trading buries edge in variance, making it impossible to distinguish whether the strategy works or whether recent results are random.
The distinction between activity and progress is measurable. A trader who takes 80 trades per month with a 48% win rate and 1.3 profit factor is generating less edge than a trader who takes 20 trades with a 52% win rate and 1.8 profit factor. The second trader is doing less but earning more per unit of risk.
Steps to audit trade count and filter for quality:
- Export all trades from the past 90 days and tag each one by setup type
- Calculate win rate, average R, and profit factor separately for each setup category
- Identify the two or three setup types with the highest profit factor
- Count how many trades in the period did not belong to those top setups
- Calculate the PnL impact of removing those lower-quality trades from your results
- Set a maximum trade count per week based on the frequency of high-quality setups historically
This audit typically reveals that 20 to 30% of trades are responsible for the majority of losses, and most of those trades were taken out of boredom, impatience, or the pressure to be active. Removing them from the strategy improves results without changing anything about the core approach. Patience and selectivity are not passive virtues. They are active risk management tools that preserve capital for the setups that actually have edge.
Key takeaways
Crypto traders who analyze performance systematically separate genuine skill from market luck, control behavioral drift, and protect their edge from overtrading and regime misattribution.
| Point | Details |
|---|---|
| Net PnL is the baseline | Always calculate profit after fees and funding before evaluating any other metric. |
| Funding requires separate tracking | Perpetual futures funding can distort gross PnL by 10 to 20% if misclassified. |
| Behavioral biases cost real money | FOMO-driven trading underperforms rules-based approaches by 1.5 to 2.5% annually. |
| Regime tagging prevents false conclusions | Tag every trade by market regime to identify which strategies have genuine edge in which conditions. |
| Activity is not progress | Filtering trades to high-quality setups improves profit factor without requiring a new strategy. |
What I have learned from treating performance review as a non-negotiable
Most traders treat performance review as something they will do when they have more time. That is exactly backwards. The traders I have observed who improve consistently are the ones who treat the monthly audit as a fixed appointment, not an optional exercise.
The uncomfortable truth is that most traders already know their weak spots. They know they overtrade on slow days. They know they hold losers too long. But knowing something intellectually and seeing it quantified in a spreadsheet are completely different experiences. When you see that your impulsive trades have a profit factor of 0.7 while your rule-compliant trades sit at 1.9, the data makes the argument that your emotions cannot override.
Keeping a consistent journal is genuinely hard. The temptation to skip logging a bad trade is real. My practical advice: log trades immediately after closing them, before the emotional distance makes the details fuzzy. A five-minute log entry right after a trade is worth more than a reconstructed entry three days later.
The long-term benefit is not just better returns. It is a more resilient trading psychology. When you have six months of data showing that your strategy works across different conditions, you can hold positions through normal drawdowns without panic. That confidence is not arrogance. It is evidence-based conviction, and it is built one honest review session at a time.
— Taneem
How Nanodata supports your performance analysis
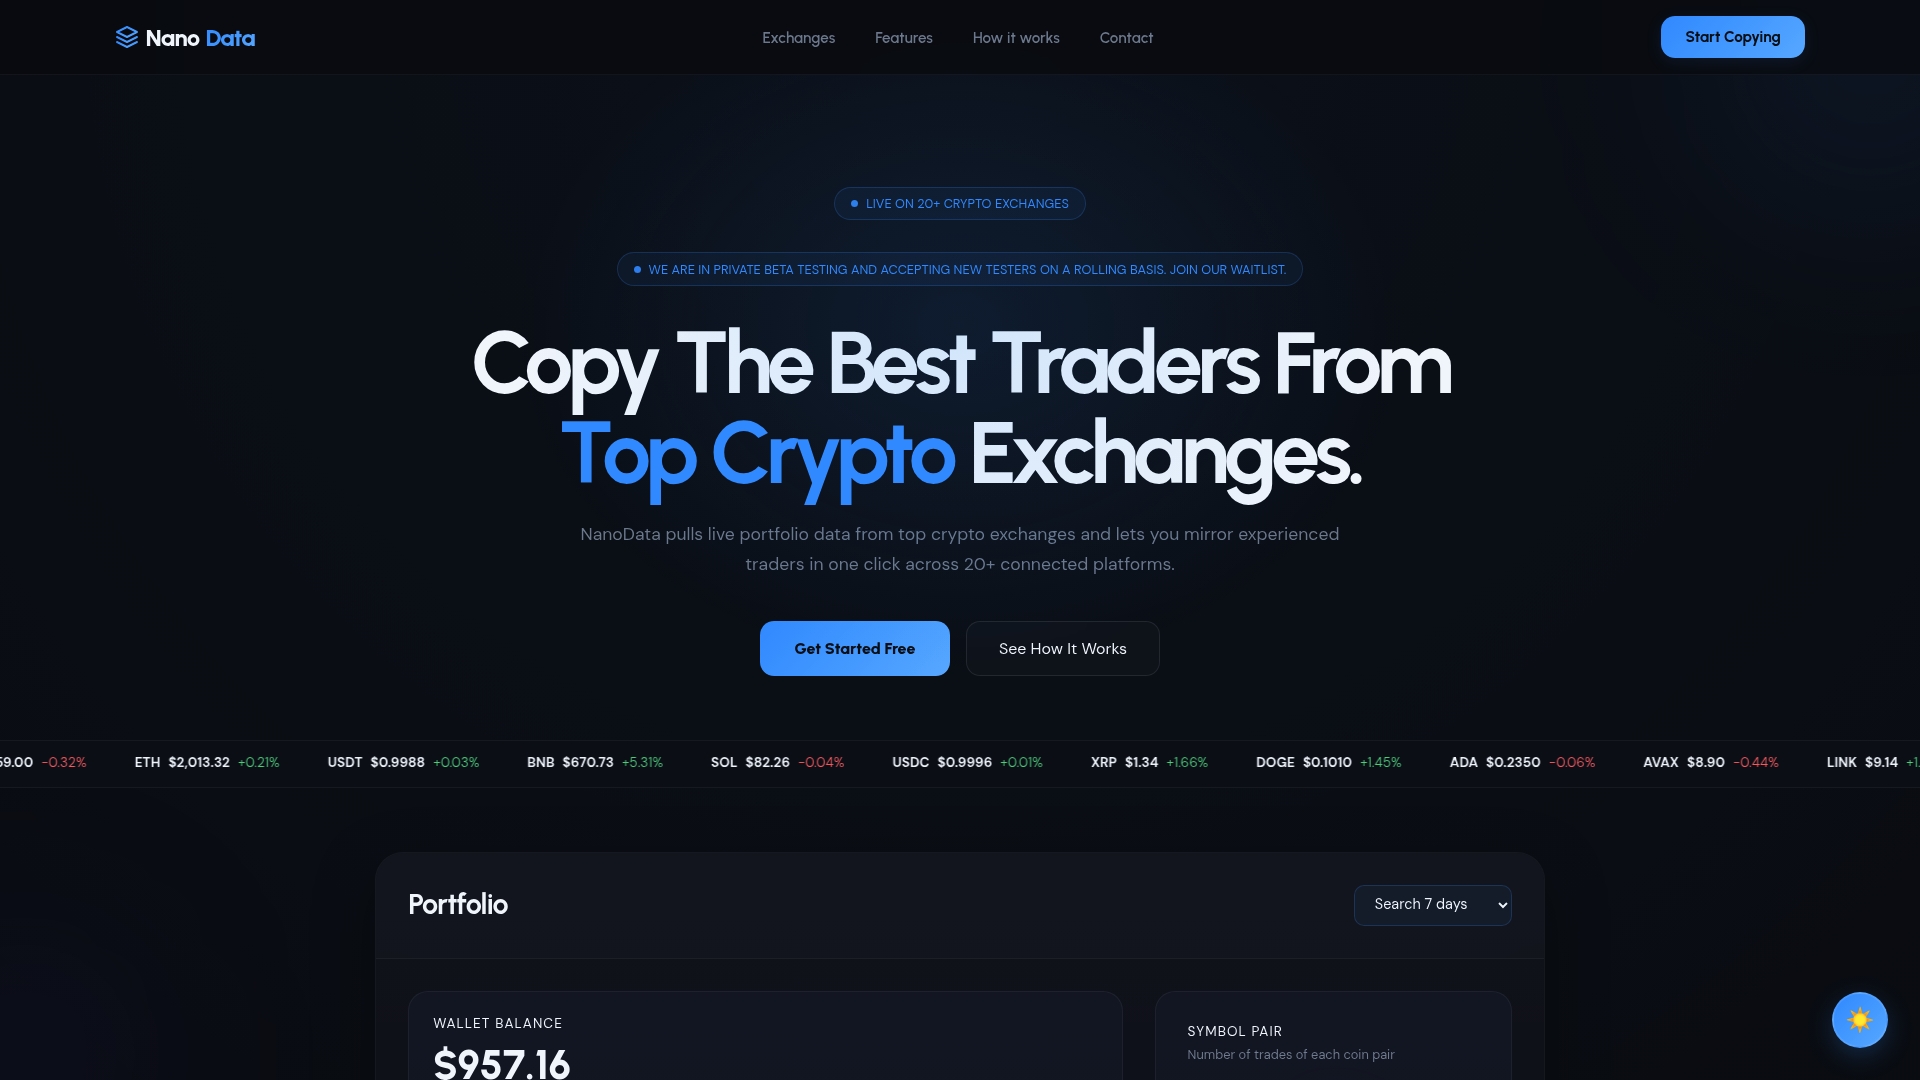
Nanodata is a crypto copy trading platform that gives traders access to leaderboards from the top 8 crypto exchanges and copy trading across 20 or more exchanges. Unlike most platforms that charge a profit share on copy trading returns, Nanodata operates on a flat £20 monthly subscription. You keep every dollar of profit you generate. For traders who want to study top-performing strategies alongside their own performance data, that structure removes a significant cost drag. Explore how Nanodata's copy trading platform can support your trading improvement process by giving you real performance benchmarks from verified traders across the market's leading exchanges.
FAQ
Why do crypto traders analyze performance instead of just tracking profits?
Tracking profits only tells you the outcome. Performance analysis explains why the outcome happened, separating execution quality, behavioral errors, and regime effects from the strategy's actual edge.
How often should a crypto trader review their performance?
Monthly performance reviews are the recommended minimum, with shorter weekly check-ins to catch behavioral drift before it compounds into material equity damage.
What is the most important metric in crypto performance analysis?
Net PnL after fees and funding is the foundational metric. It reflects true profitability and serves as the baseline against which all other KPIs, including win rate and profit factor, are interpreted.
How does perpetual futures funding affect performance analysis?
Funding payments on perpetual contracts occur every one, four, or eight hours and can represent 10 to 20% of gross PnL over months. Misclassifying them as trading fees distorts strategy attribution and leads to incorrect optimization decisions.
Can performance analysis help reduce emotional trading mistakes?
Yes. Journaling forces traders to confront actual outcomes rather than selectively remembered ones, and research shows that rules-based trading outperforms emotion-driven decisions by 1.5 to 2.5% annually.